
Page 6 - Demo
P. 6
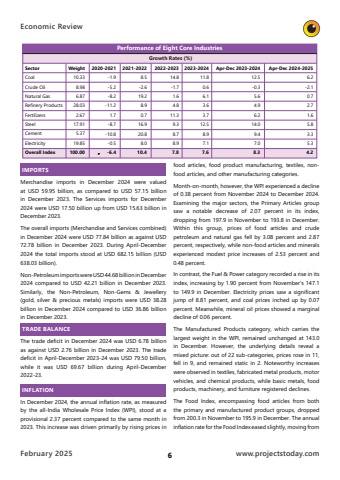
Economic Review February 2025 6 www.projectstoday.comIMPORTSMerchandise imports in December 2024 were valued at USD 59.95 billion, as compared to USD 57.15 billion in December 2023. The Services imports for December 2024 were USD 17.50 billion up from USD 15.63 billion in December 2023.The overall imports (Merchandise and Services combined) in December 2024 were USD 77.84 billion as against USD 72.78 billion in December 2023. During April-December 2024 the total imports stood at USD 682.15 billion (USD 638.03 billion).Non-Petroleum imports were USD 44.68 billion in December 2024 compared to USD 42.21 billion in December 2023. Similarly, the Non-Petroleum, Non-Gems & Jewellery (gold, silver & precious metals) imports were USD 38.28 billion in December 2024 compared to USD 36.86 billion in December 2023.TRADE BALANCEThe trade deficit in December 2024 was USD 6.78 billion as against USD 2.76 billion in December 2023. The trade deficit in April-December 2023-24 was USD 79.50 billion, while it was USD 69.67 billion during April-December 2022-23. INFLATIONIn December 2024, the annual inflation rate, as measured by the all-India Wholesale Price Index (WPI), stood at a provisional 2.37 percent compared to the same month in 2023. This increase was driven primarily by rising prices in food articles, food product manufacturing, textiles, nonfood articles, and other manufacturing categories.Month-on-month, however, the WPI experienced a decline of 0.38 percent from November 2024 to December 2024. Examining the major sectors, the Primary Articles group saw a notable decrease of 2.07 percent in its index, dropping from 197.9 in November to 193.8 in December. Within this group, prices of food articles and crude petroleum and natural gas fell by 3.08 percent and 2.87 percent, respectively, while non-food articles and minerals experienced modest price increases of 2.53 percent and 0.48 percent.In contrast, the Fuel & Power category recorded a rise in its index, increasing by 1.90 percent from November%u2019s 147.1 to 149.9 in December. Electricity prices saw a significant jump of 8.81 percent, and coal prices inched up by 0.07 percent. Meanwhile, mineral oil prices showed a marginal decline of 0.06 percent.The Manufactured Products category, which carries the largest weight in the WPI, remained unchanged at 143.0 in December. However, the underlying details reveal a mixed picture: out of 22 sub-categories, prices rose in 11, fell in 9, and remained static in 2. Noteworthy increases were observed in textiles, fabricated metal products, motor vehicles, and chemical products, while basic metals, food products, machinery, and furniture registered declines.The Food Index, encompassing food articles from both the primary and manufactured product groups, dropped from 200.3 in November to 195.9 in December. The annual inflation rate for the Food Index eased slightly, moving from Performance of Eight Core IndustriesGrowth Rates (%)SectorCoalCrude OilNatural GasRefinery ProductsFertilizersSteelCementElectricityOverall IndexWeight10.338.986.8728.032.6717.915.3719.85100.002020-2021-1.9-5.2-8.2-11.21.7-8.7-10.8-0.5-6.42021-20228.5-2.619.28.90.716.920.88.010.42022-202314.8-1.71.64.811.39.38.78.97.82023-202411.80.66.13.63.712.58.97.17.6Apr-Dec 2023-202412.5-0.35.64.96.214.09.47.08.3Apr-Dec 2024-20256.2-2.10.72.71.65.83.35.34.2
