
Page 23 - Demo
P. 23
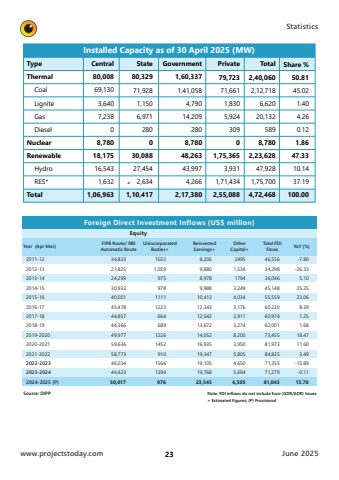
www.projectstoday.comJune 2025Statistics23Installed Capacity as of 30 April 2025 (MW)TypeThermal Coal Lignite Gas DieselNuclearRenewable Hydro RES*TotalCentral80,00869,1303,6407,23808,78018,17516,5431,6321,06,963State80,32971,9281,1506,971280030,08827,4542,6341,10,417Government1,60,3371,41,0584,79014,2092808,78048,26343,9974,2662,17,380Private79,72371,6611,8305,92430901,75,3653,9311,71,4342,55,088Total2,40,0602,12,7186,62020,1325898,7802,23,62847,9281,75,7004,72,468Share %50.8145.021.404.260.121.8647.3310.1437.19100.00Foreign Direct Investment Inflows (US$ million)EquityYear (Apr-Mar) 2011-12 2012-13 2013-14 2014-15 2015-16 2016-17 2017-18 2018-19 2019-2020 2020-2021 2021-2022 2022-2023 2023-2024 2024-2025 (P)34,83321,82524,29930,93340,00143,47844,85744,36649,97759,63658,77346,03444,42350,017FIPB Route/ RBIAutomatic RouteUnincorporatedBodies+10221,059975978111112236646891226145291015661394976ReinvestedEarnings+8,2069,8808,9789,98810,41312,34312,54213,67214,05216,93519,34719,10519,76823,545OtherCapital+24951,53417943,2494,0343,1762,9113,2748,2003,9505,8054,6505,6946,505Total FDIFlows46,55634,29836,04645,14855,55960,22060,97462,00173,45581,97384,83571,35571,27981,043YoY (%)-7.80-26.335.1025.2523.068.391.251.6818.4711.603.49-15.89-0.1113.70Source: DIPPNote: FDI inflows do not include Euro (GDR/ADR) Issues+ Estimated Figures; (P) Provisional
