
Page 21 - Demo
P. 21
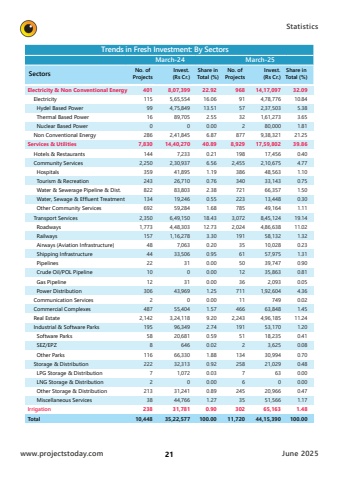
www.projectstoday.comJune 2025Statistics21Trends in Fresh Investment: By SectorsMarch-24March-25SectorsNo. ofProjectsInvest.(Rs Cr.)Share inTotal (%)No. ofProjectsInvest.(Rs Cr.)Share inTotal (%)Electricity & Non Conventional Energy Electricity Hydel Based Power Thermal Based Power Nuclear Based PowerNon Conventional EnergyServices & UtilitiesHotels & Restaurants Community Services Hospitals Tourism & Recreation Water & Sewerage Pipeline & Dist. Water, Sewage & Effluent Treatment Other Community ServicesTransport Services Roadways Railways Airways (Aviation Infrastructure) Shipping Infrastructure Pipelines Crude Oil/POL Pipeline Gas Pipeline Power DistributionCommunication Services Commercial Complexes Real Estate Industrial & Software Parks Software Parks SEZ/EPZ Other ParksStorage & Distribution LPG Storage & Distribution LNG Storage & Distribution Other Storage & Distribution Miscellaneous ServicesIrrigationTotal401115991602867,8301442,2503592438221346922,3501,773157484422101230624872,142195588116222722133823810,4488,07,3995,65,5544,75,84989,70502,41,84514,40,2707,2332,30,93741,89526,71083,80319,24659,2846,49,1504,48,3031,16,2787,06333,5063103143,969055,4043,24,11896,34920,68164666,33032,3131,072031,24144,76631,78135,22,57722.9216.0613.512.550.006.8740.890.216.561.190.762.380.551.6818.4312.733.300.200.950.000.000.001.250.001.579.202.740.590.021.880.920.030.000.891.270.90100.0096891573228778,9291982,4553863407212237853,0722,0241913561501236711114662,243191512134258762453530211,72014,17,0974,78,7762,37,5031,61,27380,0009,38,32117,59,80217,4562,10,67548,56333,14366,35713,44849,1648,45,1244,86,63858,13210,02857,97539,74735,8632,0931,92,60474963,8484,96,18553,17018,2353,62530,99421,02963020,96651,56665,16344,15,39032.0910.845.383.651.8121.2539.860.404.771.100.751.500.301.1119.1411.021.320.231.310.900.810.054.360.021.4511.241.200.410.080.700.480.000.000.471.171.48100.00
