
Page 5 - Demo
P. 5
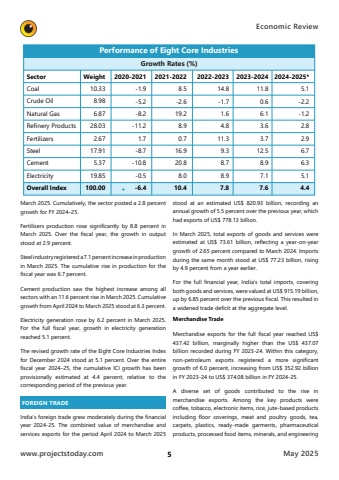
www.projectstoday.comMay 2025Economic Review 5March 2025. Cumulatively, the sector posted a 2.8 percent growth for FY 2024%u201325.Fertilisers production rose significantly by 8.8 percent in March 2025. Over the fiscal year, the growth in output stood at 2.9 percent.Steel industry registered a 7.1 percent increase in production in March 2025. The cumulative rise in production for the fiscal year was 6.7 percent.Cement production saw the highest increase among all sectors with an 11.6 percent rise in March 2025. Cumulative growth from April 2024 to March 2025 stood at 6.3 percent.Electricity generation rose by 6.2 percent in March 2025. For the full fiscal year, growth in electricity generation reached 5.1 percent.The revised growth rate of the Eight Core Industries Index for December 2024 stood at 5.1 percent. Over the entire fiscal year 2024%u201325, the cumulative ICI growth has been provisionally estimated at 4.4 percent, relative to the corresponding period of the previous year.FOREIGN TRADEIndia%u2019s foreign trade grew moderately during the financial year 2024-25. The combined value of merchandise and services exports for the period April 2024 to March 2025 stood at an estimated US$ 820.93 billion, recording an annual growth of 5.5 percent over the previous year, which had exports of US$ 778.13 billion.In March 2025, total exports of goods and services were estimated at US$ 73.61 billion, reflecting a year-on-year growth of 2.65 percent compared to March 2024. Imports during the same month stood at US$ 77.23 billion, rising by 4.9 percent from a year earlier.For the full financial year, India%u2019s total imports, covering both goods and services, were valued at US$ 915.19 billion, up by 6.85 percent over the previous fiscal. This resulted in a widened trade deficit at the aggregate level.Merchandise TradeMerchandise exports for the full fiscal year reached US$ 437.42 billion, marginally higher than the US$ 437.07 billion recorded during FY 2023-24. Within this category, non-petroleum exports registered a more significant growth of 6.0 percent, increasing from US$ 352.92 billion in FY 2023-24 to US$ 374.08 billion in FY 2024-25.A diverse set of goods contributed to the rise in merchandise exports. Among the key products were coffee, tobacco, electronic items, rice, jute-based products including floor coverings, meat and poultry goods, tea, carpets, plastics, ready-made garments, pharmaceutical products, processed food items, minerals, and engineering Performance of Eight Core IndustriesGrowth Rates (%)SectorCoalCrude OilNatural GasRefinery ProductsFertilizersSteelCementElectricityOverall IndexWeight10.338.986.8728.032.6717.915.3719.85100.002020-2021-1.9-5.2-8.2-11.21.7-8.7-10.8-0.5-6.42021-20228.5-2.619.28.90.716.920.88.010.42022-202314.8-1.71.64.811.39.38.78.97.82023-202411.80.66.13.63.712.58.97.17.62024-2025*5.1-2.2-1.22.82.96.76.35.14.4
